Read: 10 - JS Debugging
Today Topic will be a about JS Handling Error & Debugging
In the Artical we will learn about
- THE CONSOLE & DEV TOOLS
- COMMON PROBLEMS
- HANDLING ERRORS
JS Topics
ORDER OF EXECUTION
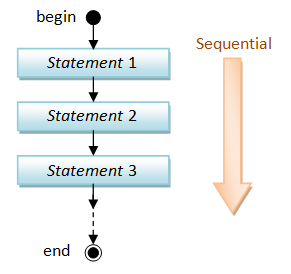
To find an error, we need to know how scripts are processed. The order in which statements are executed can be complex; some tasks cannot complete until another statement or function has been run:
The Stack JS processes one line code at the time when a statement needs data from another function , it stacks the new function om top of the current task
Scope
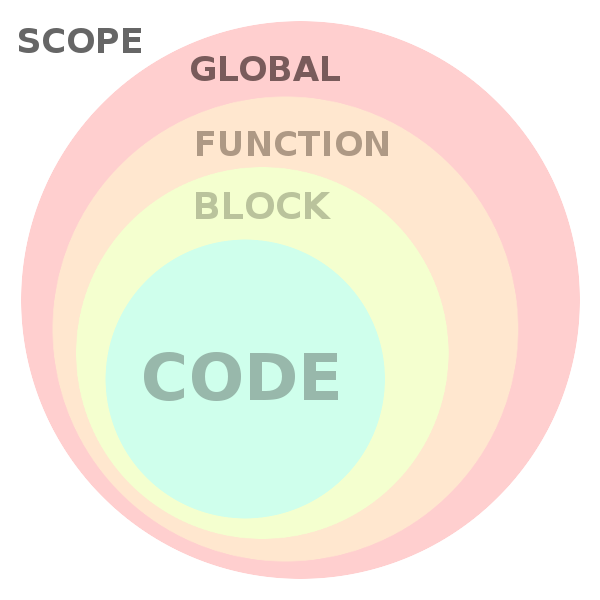
Understanding scope will make your code stand out, reduce errors and help you make powerful design patterns with
What is The Scope Scope is the accessibility of variables, functions, and objects in some particular part of your code during runtime. In other words, scope determines the visibility of variables and other resources in areas of your code
Type of Scope in js JavaScript language there are two types of scopes
Global ScopeLocal Scope
Variables defined inside a function are in local scope while variables defined outside of a function are in the global scope. Each function when invoked creates a new scope
For Example - global -
 // the scope is by default global

var name = 'Hammad';

console.log(name); // logs 'Hammad'

function logName() {
    console.log(name); // 'name' is accessible here and everywhere else
}

logName(); // logs 'Hammad'
For Example - Local -
function someFunction() {
    // Local Scope #1
    function someOtherFunction() {
        // Local Scope #2
    }
}
UNDERSTANDING ERRORS
If a JavaScript statement generates an error, then it throws an exception. At that point, the interpreter stops and looks for exception-handl ing code.
ERROR OBJECTS
Error objects can help you find where your mistakes are and browsers have tools to help you read them.
Error objects are thrown when runtime errors occur. The Error object can also be used as a base object for user-defined exceptions. See below for standard built-in error types.
For More Info : developer mozilla
HOW TO DEAL WITH ERRORS
there are two things you can do with the errors.
- DEBUG THE SCRIPT TO FIX ERRORS
- HANDLE ERRORS GRACEFULLY
A DEBUGGING WORKFLOW
Debugging is about deduction: eliminating potential causes of an error
BROWSER DEV TOOLS & JAVASCRIPT CONSOLE The JavaScript console will tell you when there is a problem with a script,where to look for the problem, and what kind of issue it seems to be
HOW TO LOOK AT ERRORS IN CHROME
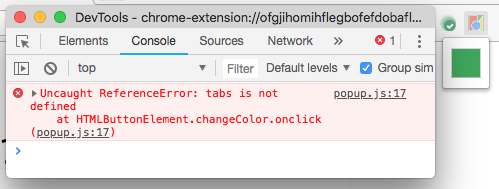 The console will show you when there is an error in your JavaScript
In Chrome, navigate to Tools > Advanced > Error Console. The error console will open. Select JavaScript and Errors from the two drop downs. To find the error location, expand one of the errors.
WRITING FROM THE SCRIPT TO THE CONSOLE
Browsers that have a console have a console object, which has several methods that your script can use to display data in the console. The object is documented in the Console API
LOGGING DATA TO THE CONSOLE
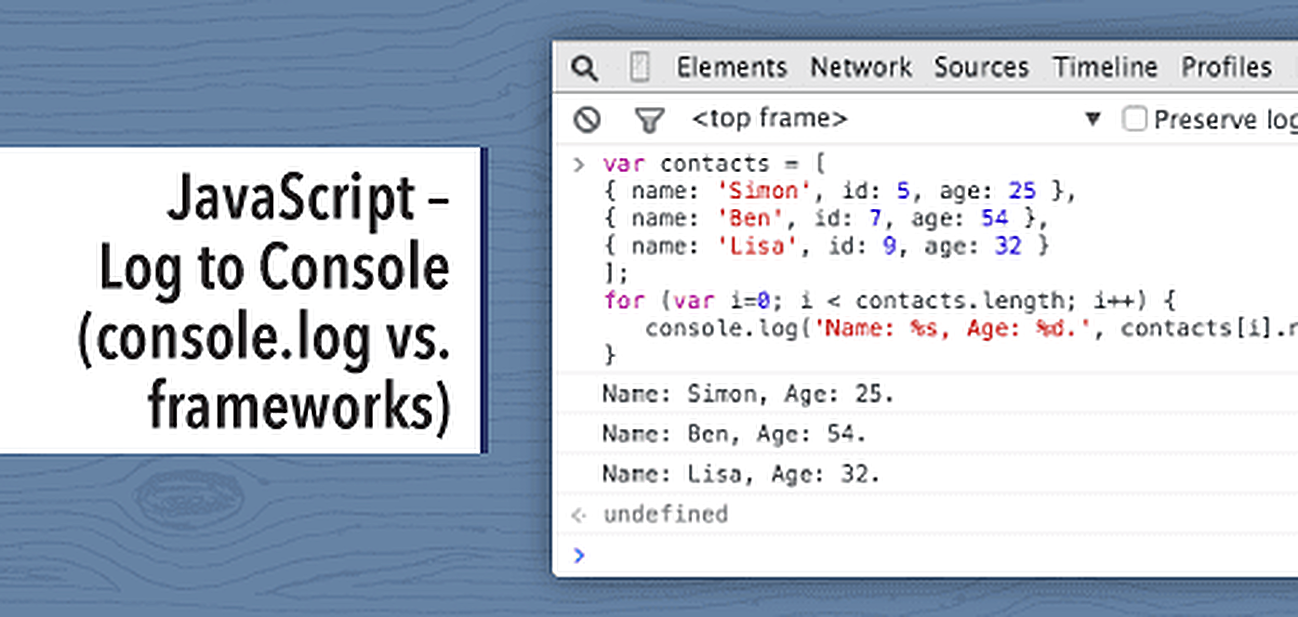
Usingconsole.log ()method.
var myObj = { firsname : "John", lastname : "Doe" };
console.log(myObj);
Contact Info :
Please Feel Free To Contact Me When You Need help ^_^
- www.facebook.com/aghyadalbalkhi
- Email : aghyadalbalkhi@gmail.com